We analyzed 100 recent small website sales to get some hard numbers around why some sites make more than others. The expected profit of a small website can be predicted by analyzing the audience, content type, and revenue model.

This article is the full version of our website revenue model analysis. For those of you in a hurry to play with some numbers, we packaged up the ideas behind this article in a website revenue estimator. This tool will estimate the revenue for your website and suggests appropriate strategies for increasing the value of your business.
Why We Did This Study…
I developed a keen interest in understanding website revenue model statistics about six months after launching our first website. We started running ads on the site about three months after launch. By month six, my competitive nature was surfacing. How did our revenue model performance compare with similar websites?
Unfortunately, most of the revenue statistics that we found were sufficiently vague or biased that they were useless. So we had to create our own dataset (details below). We collected post-sale information on 100 small websites that were sold on a major exchange. These were manually reviewed, compared with each other, and cross-checked against independent sources.
Our screening process had a simple litmus test: could I explain to my spouse with a straight face why I considered that website to be a reasonable investment? This eliminated the crazy stuff and SEO stunts. The remaining sites were a motley crew, but each one represented a legitimate business.
From a sampling perspective, the statistics of these websites represent a middle tier of commercially successful small websites. We dumped any website that was a “parts sale” (no revenue model or real traffic) or had trivial sales (<$200/month). The very best sites are likely to have disappeared into private sales or website brokerage services.
The public auction process serves as a moderating influence. We selected only sites that completed a transaction to weed out dubious claims. There was enough due diligence done during the sale that the obvious fraud was identified. This data should be viewed a starting point for “what good looks like”. It is possible for your site to beat these numbers and you should definitely be concerned if your performance is below these standards.
There were three key metrics we looked at:
- Average Valuation: Sale Price as a multiple of monthly profit
- Average Profit / Visitor – Profit per Unique Monthly Visitor. Provides insight into the intrinsic value of the website’s traffic. It also is a constraint on using PPC campaigns to rapidly scale your traffic.
- Average Profit / 1K pageviews (aka RPM) – Profit per mille; the relevant metric for advertising supported websites. Content sites are fixated on this metric.
Profit was measured as “net revenue”: cash income net of variable expenses. This let us work around differences in cost-to-serve. For most advertising supported sites with SEO programs this is very close to a conventional RPM statistic. We added appropriate adjustments for dropship programs, service sites, and high-touch content sites to show the net revenue for the sites on an comparable basis.
We looked at each site as a single data point and aggregated performance data using simple averages. Each site counts as one vote. Where possible, we cross-checked our conclusions against ad agency studies and similar sources to confirm trends.
Audience Segmentation
We started by segmenting the websites into four groups based on the “buying interest” of their traffic. In rating a site, we evaluated three factors about the site’s audience.
- Audience Type: Is the audience a cross-section of the general public (0 points ) or a targeted audience where we can identify a relevant offers (1 point)?
- Conversion Value: If we can identify a target audience and offer, will advertisers pay a little (0 points) or a lot (1 point) for incoming clicks from this audience? If the site sells their own product or service, we gave them the point since the site will enjoy a greater share of the revenue generated by any sales.
- Buying funnel Position: If we can identify a target audience and set of offers, are they close to making a purchase (Yes = 1 point, No = 0 points)?
Each question (factor) is worth a point. Add the points to get the final score.
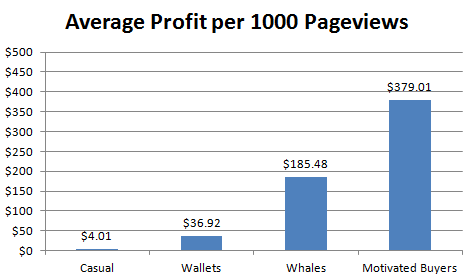
I don’t expect the same revenue statistics for a casual gaming site or blog that I would expect for an E-commerce site or SEO Service Bureau. The model proved this out:
Casual Visitors (0 points) represent the majority of web surfers and are visiting the website for reasons unrelated to making a purchase. Think of it from the visitor’s perspective – they came to read the latest pop-star article and they are presented with an ad for sneakers. There is minimal alignment between the visitor and the advertisement. This is common for blogs and entertainment sites. This type of traffic is fairly easy to acquire via SEO.
Wallets (1 point) are audiences where you can identify targeted offers that your visitors would likely be interested in. For example, a site with free PHP scripts should be able to successfully promote offers for hosting, SEO support, etc. To rank for these keywords, you will need to significantly step up the intensity and focus of your SEO efforts.
Whales (2 points) are wallets with high value problems (fix my DUI, cure my illness, find a job or part time gig) or who are close to spending money on a big purchase. This can be assessed by looking at their search terms. It can be challenging to achieve a high SERP rank in these keywords. However, you aren’t necessarily making enough per visit to support lots of PPC ads.
Motivated Buyers (3 points) won the trifecta. They are visiting the website because they are close buying a specific high value product or service. This data also shows the contrast in revenue between advertising models and higher level e-commerce options. Value per visitor can varies widely within this population based on the audience, offer, and product economics. The economics here frequently supports PPC advertising; you may also want to consider developing your own affiliate program to boost your traffic.
It is possible to make significant amounts of money in each of these audiences. Your objective should be to focus your promotion strategy and revenue goals so they are appropriate to the your target audience. Once you’ve solved for the big picture, you can define segments and customer groups as good / bad based on how they fit into your strategy.
The numbers carry over in the revenue-per-mille (thousand pageviews) metrics as well.
Keen observers will notice I just rationalized your marketing team delivering a RPM metric anywhere between single digits and triple digits.
So much for industry averages.
These statistics are generally consistent with other sources. RPM statistics for blogs and content sites targeting casual and wallet audiences are similar to data from the Adify Vertical Gauge report (last source is several years old). These results are also in line with observed difference between Facebook and Linkedin’s revenue models. Linkedin makes $1.30 per hour visitors spend on the site, Facebook makes 6.2 cents per hour. Using our model, Facebook scores close to a zero (social use by the general public) and Linkedin would score a 3 or 4 (recruiters/salespeople, B2B lead generation, ready to purchase, significant revenue generated from Linkedin’s “House Product”- a recruiting platform).
How well an individual site executes an advertising program will affect the results. Within our data, the top 20% of sites earned 3 x as much as the bottom 20%, adjusting for similar levels of commercial interest. There was a strong power law in effect, results were not normally distributed. We tested AdSense Optimization strategies and found you can often get a nice bump from tweaking page layouts, colors, designs, and ad sizes. One automated AdSense optimization vendor, Ezoic, publishes a client scorecard which is reporting a 140% average lift (scroll down the page to see their scorecard) in revenue across a large sample. So there’s definitely room to improve within most of these metrics
Website valuation multiples dropped very rapidly as value-per-visitor increased. I suspect this is driven by several factors:
- Buyer expectations that they can significantly boost revenues from sites with low revenue metrics. Most buyers are overconfident about their abilities in this space.
- Higher expected ongoing SEO costs and greater risk of new entrants and clones. This is especially true if a website built traffic by “sneaking” into tertiary keywords the authority sites missed. These sites are highly exposed to competitor actions.
- Greater exposure to short product cycles. SEO service offerings change every 12 months. Leadership in the mobile phone handset space changes every two years. In contrast, people have been reading the news for hundreds of years and playing scrabble for 90 years. When a website’s revenue stream is closely tied to a single product / issue, buyers expect that site will have a shorter life expectancy.
Revenue Model Comparisons
Our next cut of data looked at revenue performance by site type.
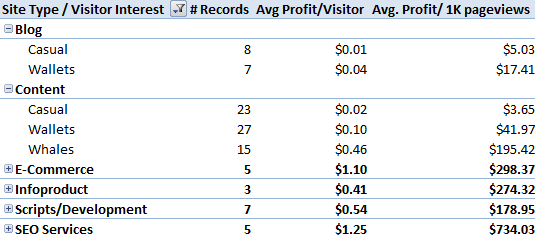
You can cluster this into three broad sets:
- Blogs – content based sites which require a regular stream of new articles
- Content – content sites that can be managed as a process once you have established an appropriate level of traffic. Where possible, we deducted a “management cost” if regular upkeep was required.
- Product/Service Sites – built around buying / selling a product or service.
Blogs and content sites targeted at “casual” users are a volume business. Use SEO to attract large blocks of low profit-per-visit traffic for free and run generic ads. Avoid any per-user service cost like the plague unless it’s directly attached to a revenue source.
Content sites targeted at “wallets” and “whales” can do better. The audience has enough purchasing interest that you can start generating decent conversion rates for relatively high value offers. As you will see in a moment, your actual earnings will be highly influenced by your marketing tactics and your choice of offers / revenue model.
This was not a deep survey of product / service sites – we included them in the data primarily to highlight the difference in earning power vs. a ad supported content site. Their average earnings per visitor is much higher than a content site. There was a lot of variation in the revenue metrics within this sample. The earning power of an individual site in this category was driven by product economics and audience position within the buying funnel. From a metrics perspective, EPC (earnings per click) matters more than RPM (pageview earnings). These sites have the earning power to fund a PPC campaign to accelerate growth.
Revenue Model Differences
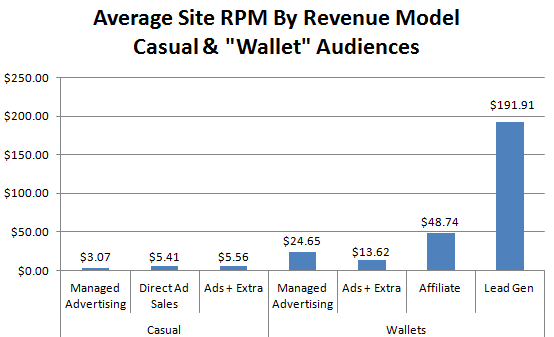
We looked at the revenue metrics by visitor interest level and revenue generation strategy. Here’s a summary of that information for the casual & wallets audiences.
Some quick definitions:
- Managed Advertising – online advertising where the publisher doesn’t manage ad procurement and selection. AdSense is the market leader in this space. These results include data from sites using multiple networks and non-AdSense sites.
- Direct Ad Sales – advertisement or sponsorship arranged directly between the website and the advertiser.
- Ads + Extra – primary monetization model is some form of managed advertising; however, there is a significant secondary income stream from affiliate marketing, paid posts, additional paid services, or compensation for promotional activities.
- Affiliate – The site’s primary monetization model is an affiliate marketing program.
- Lead Generation – Affiliate marketing on steroids; the site’s monetization model is collecting contact information and passing it to an outbound marketing program.
Some insights from this data:
- For those of you with “casual” audience types, your revenue per visitor will stink. Small sites should consider simplifying their objectives. Implement a managed advertising program and spend your time figuring out how to get more traffic.
- However, be ready to take advantage of the promotional value of a big “casual” content site. The top sites in this space padded their earnings by developing sponsorship / direct ad deals, doing paid articles, and other promotional support. This is also the point where you really should be looking at doing some AdSense optimization; we’ve found this to be a very high return-on-time activity if you have the traffic.This approach earned them about 60% more than a vanilla ad-supported site.
- Websites with high value traffic (eg. “wallets” and “whales”) should consider building an affiliate marketing program. The lead generation model was an absolute powerhouse, in terms of driving revenue-per-visitor.
One final set of data – there was a significant variation in the Revenue-Per-Mille within each of these groups. Here’s a distribution of the RPM data for the casual traffic segment (of interest to most new webmasters, since it’s easiest to rank for).
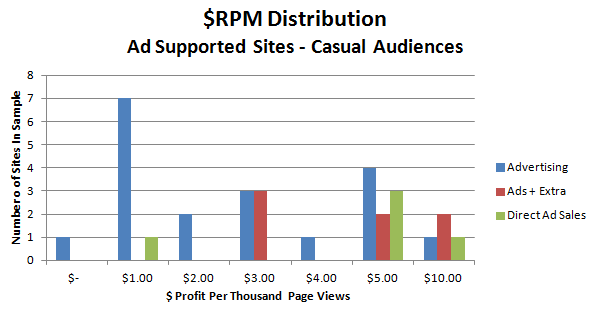
Now this chart is pretty interesting. The average earnings per thousand pageviews (RPM) for the sites in this category is about $4. But look at the spread!
- There is a nice cluster of sites with RPM’s between $5 and $15.
- However, 25% of the sites – and 50% of the participants in a managed advertising programs – were earning under $2 per thousand pageviews! One site was as low as $.50 per thousand pageviews. Ouch!
Some of this spread driven by how well an advertising program was executed: the page layout, color scheme, and which ads sizes you pick matters immensely. One automated AdSense optimization vendor (Ezoic) reports they’ve delivered an average lift of 140% across their client base (7000+ sites, as of this writing). This validates that many sites are operating well below potential and leaving money on the table in how they place their ads.
The other key difference between the two groups? Secondary revenue streams. As the chart shows, many high earning content sites sell direct advertising placements or have incorporated affiliate marketing deals or promotional services into their models.
Many marketing-savvy webmasters probably use both approaches. The fastest money for a content site comes from optimizing your advertising placements. We’ve seen 50%+ lifts on our sites with manual optimization efforts, generally requiring only a couple of hours of work to tweak AdSense settings and implement a couple A / B tests in Google Analytics. Ezoic offers an automated version of this (with extra perks from being a Google AdSense partner, like running 5 ads vs 3 on a page; they’re worth checking out if you’re looking for a way to boost revenue without getting into the marketing weeds).
Earning a higher return on your traffic through affiliate marketing requires you to identify relevant offers and learn how to create a conversion process. We’ve seen affiliate programs return 12 x more than managed ads for the same traffic (real number from one of our own sites), but this required a significant investment in creating original content to establish authority and testing conversion strategies (no shortcuts here, sorry…). Either way, the extra hustle of building or optimizing your program can really pay off.
Closing Comments
Deming, one of the founders of the modern quality movement, once stated: 85% of a worker’s effectiveness is determined by the system he works within, only 15% by his own skill.
The same concept applies to your site’s earnings. Think about how you’re positioning your site from a strategic perspective. What level of “buying interest” are your targeting? How deeply do you want to market to your visitors? Then set appropriate goals.
Profitable websites exist targeting each of these traffic types. You need to understand where your site fits into this model and market accordingly. Market too soft and you will leave money on the table. Market too aggressively and you will lose your audience.
And check out our website revenue calculator which puts these ideas into action.
Methodology Notes
Since we are comparing performance across different types of websites, we needed a comparable definition of revenue. Our definition is “net revenue”. We took the site’s claimed income from all sources and deducted disclosed or suspected variable costs. This includes any marketing costs (PPC/banner ads), product / service fulfillment costs, hosting expenses, and content management costs. Labor was estimated at US market rates unless already outsourced. We did not assess a writing cost for blogs outside of paid articles due to the variety of low-cost options for sourcing blog content. This definition lets us to compare different sites – eg. ad supported site vs. a dropship operation – on the basis of earnings returned to a passive owner.
We don’t claim to have measured the full site ROI. In the real estate business, rent data submitted by a seller are referred to as “liar’s statements”. There are often a number of things missing. The sale disclosure numbers generally didn’t include a management fee or technical support costs. Furthermore, large blocks of evergreen content and/or SEO campaigns appear to be treated as capital investments. However, these statistics are at least consistently biased within the sample, making them useful for valuation work.
This data is still useful. In the real estate industry, knowledgeable buyers know the usual operating ratios for a building (what % of rent is required for maintenance). The same applies in the Internet business. From a practical perspective, we assume any buyer is technically proficient and has multiple sites under management. To keep costs down, we assume they are using a CMS, web framework, or ad-hoc web development platform. This combination of expertise and process/software allows the new owner to handle routine maintenance and occasional content updates at minimal cost.
This analysis does not give credit for two common sources of value for small websites. Many software developers and consultants generate significant value from their blogs, in the form of consulting engagements and career opportunities. Many local companies generate significant traffic from their sites. Unfortunately, these two approaches require ongoing time to deliver services or an investment in offline infrastructure, limiting the site’s potential as a semi-passive investment. Incidentally – if you are lucky enough to have this sort of traffic, consider setting up a lead generation program with a qualified provider (assuming you don’t want to handle the work yourself). Many of the WordPress plugin and theme sites reported generating several thousand dollars per month of requests for custom development projects – without much marketing effort..
Final comment – if you work for a large organization, you make want to do some internal benchmarking with the market research department and enterprise analytics team. You should expect your results to be slightly better than these numbers – your company will be able to get a better deal from advertisers and has more resources to build up sales funnels and remarketing programs around your traffic. Size matters.
For those of you with “casual” audience types, your revenue per visitor will stink. Small sites should consider simplifying their objectives. Implement a managed advertising program and spend your time figuring out how to get more traffic…
Nicely presented and good use of data! Thanks for sharing this with us.